Background
As the start of a new semester approaches, many math departments throughout the United States have the task of assigning graduate students to Teaching Assistant (TA) positions. These decisions might be made based on a variety of factors such as the graduate student's mathematical background, time availability, or even the instructor's prefence. Usually these assignments might be done by hand or through a committee and so we would like to implement an algorithm to find a feasible assignment.
Due to all of the number of graduate students, the number of courses, and the number of constraints imposed, this task is not easy. For this reason, we decided to tackle a similar problem on a smaller number of people and with fewer constraints. Assigning undergraduate students to research groups in the University of Kentucky Math Lab allows us to find a simpler algorithm in this way. The number of students is around 20, the number of groups is around 4, and typically the most important constraints to keep in mind are the time availabilities of the students and professors leading the research groups, and the students' preferences for which group they want to be a part of.
Algorithm
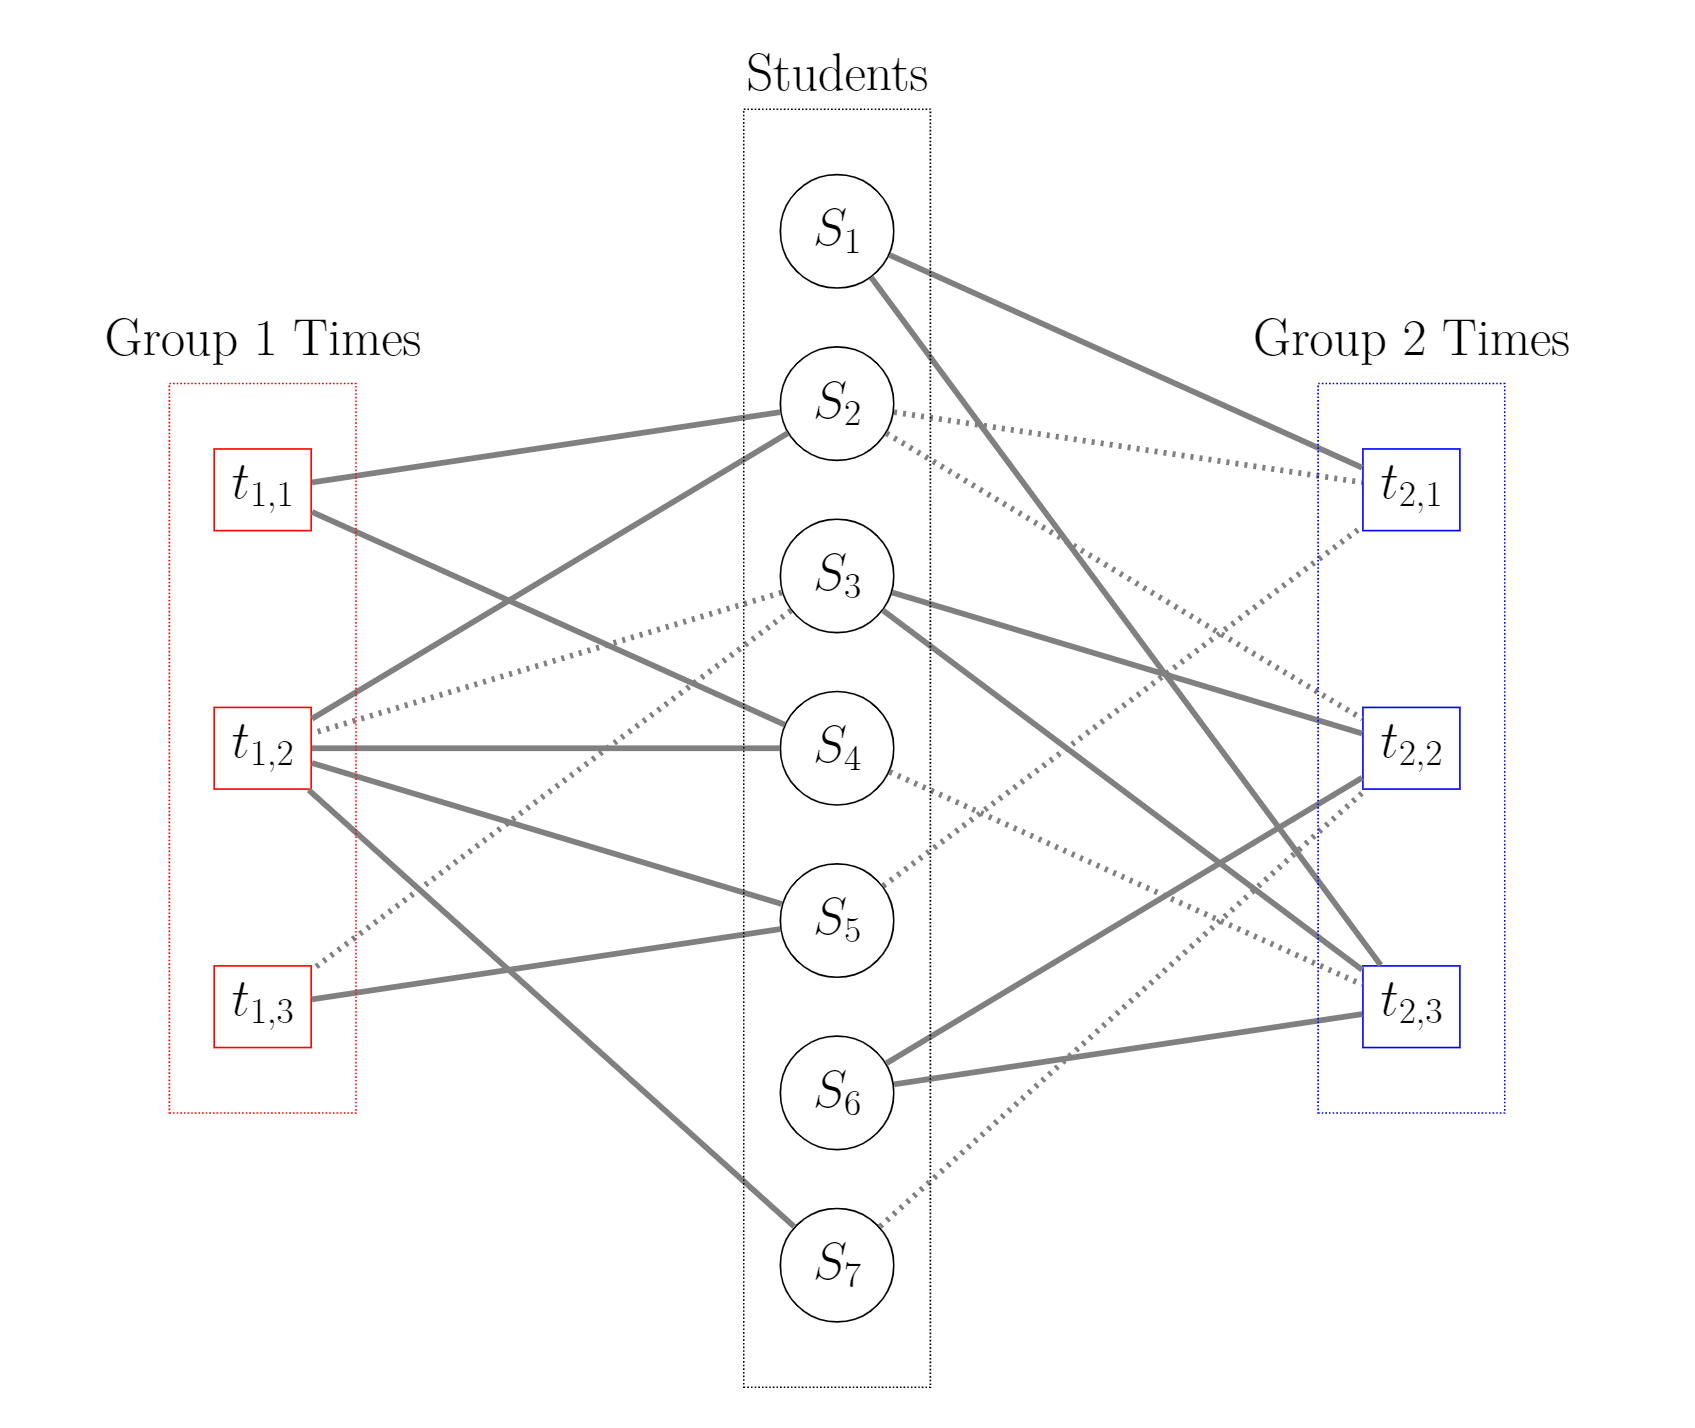
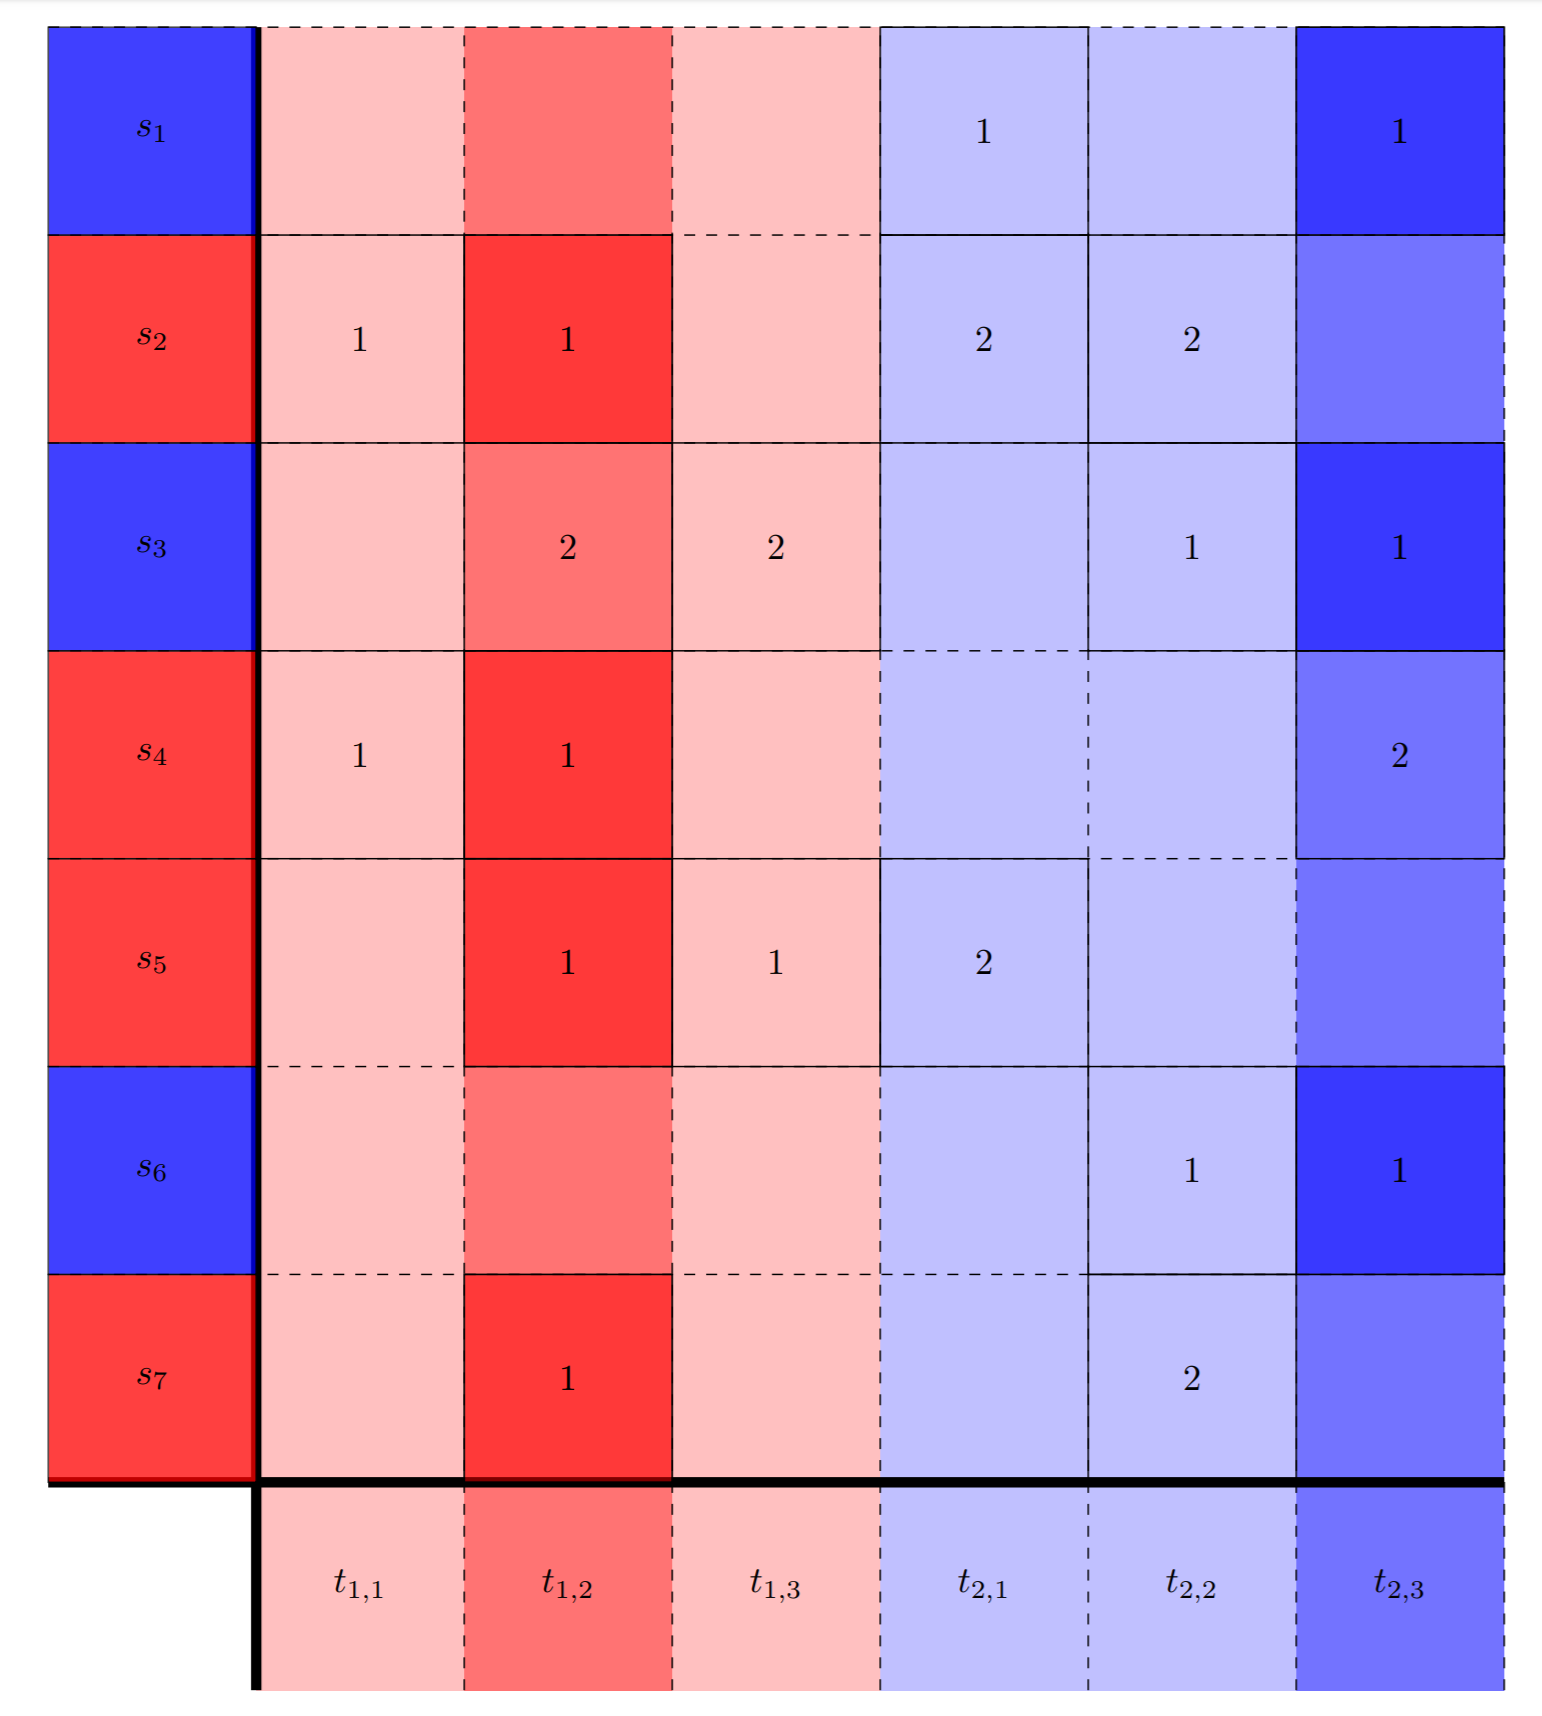
We can formulate this problem in terms of finding an optimal subgraph of a (bipartite) graph. Consider a set of nodes representing students and also a set of nodes for each lab groups available times. We draw an edge from a student node to a lab group time node if the student has that time available. We then represent preferences through weighted edges (or pictorally through solid or dashed edges).
In this example, we have a set of 7 students and 2 groups. Each group also has 3 available times. Note that although a group's times are distinct, different groups may share similar times since they are all independent of each other. From here, we draw the edges as specified, e.g. \( s_1 \rightarrow t_{2,1} \) since the Student 1 can meet at Group 2's first time. Then we can add weights to the edges. In the picture, we represent this through solid and dashed lines since adding numbers to each edge made the picture cluttered. For instance, the edges between Student 2 and Group 1 are solid since Student 2 preferred Group 1, whereas the edges from Student 2 to Group 2 are dashed since Student 2 preferred Group 2 second.
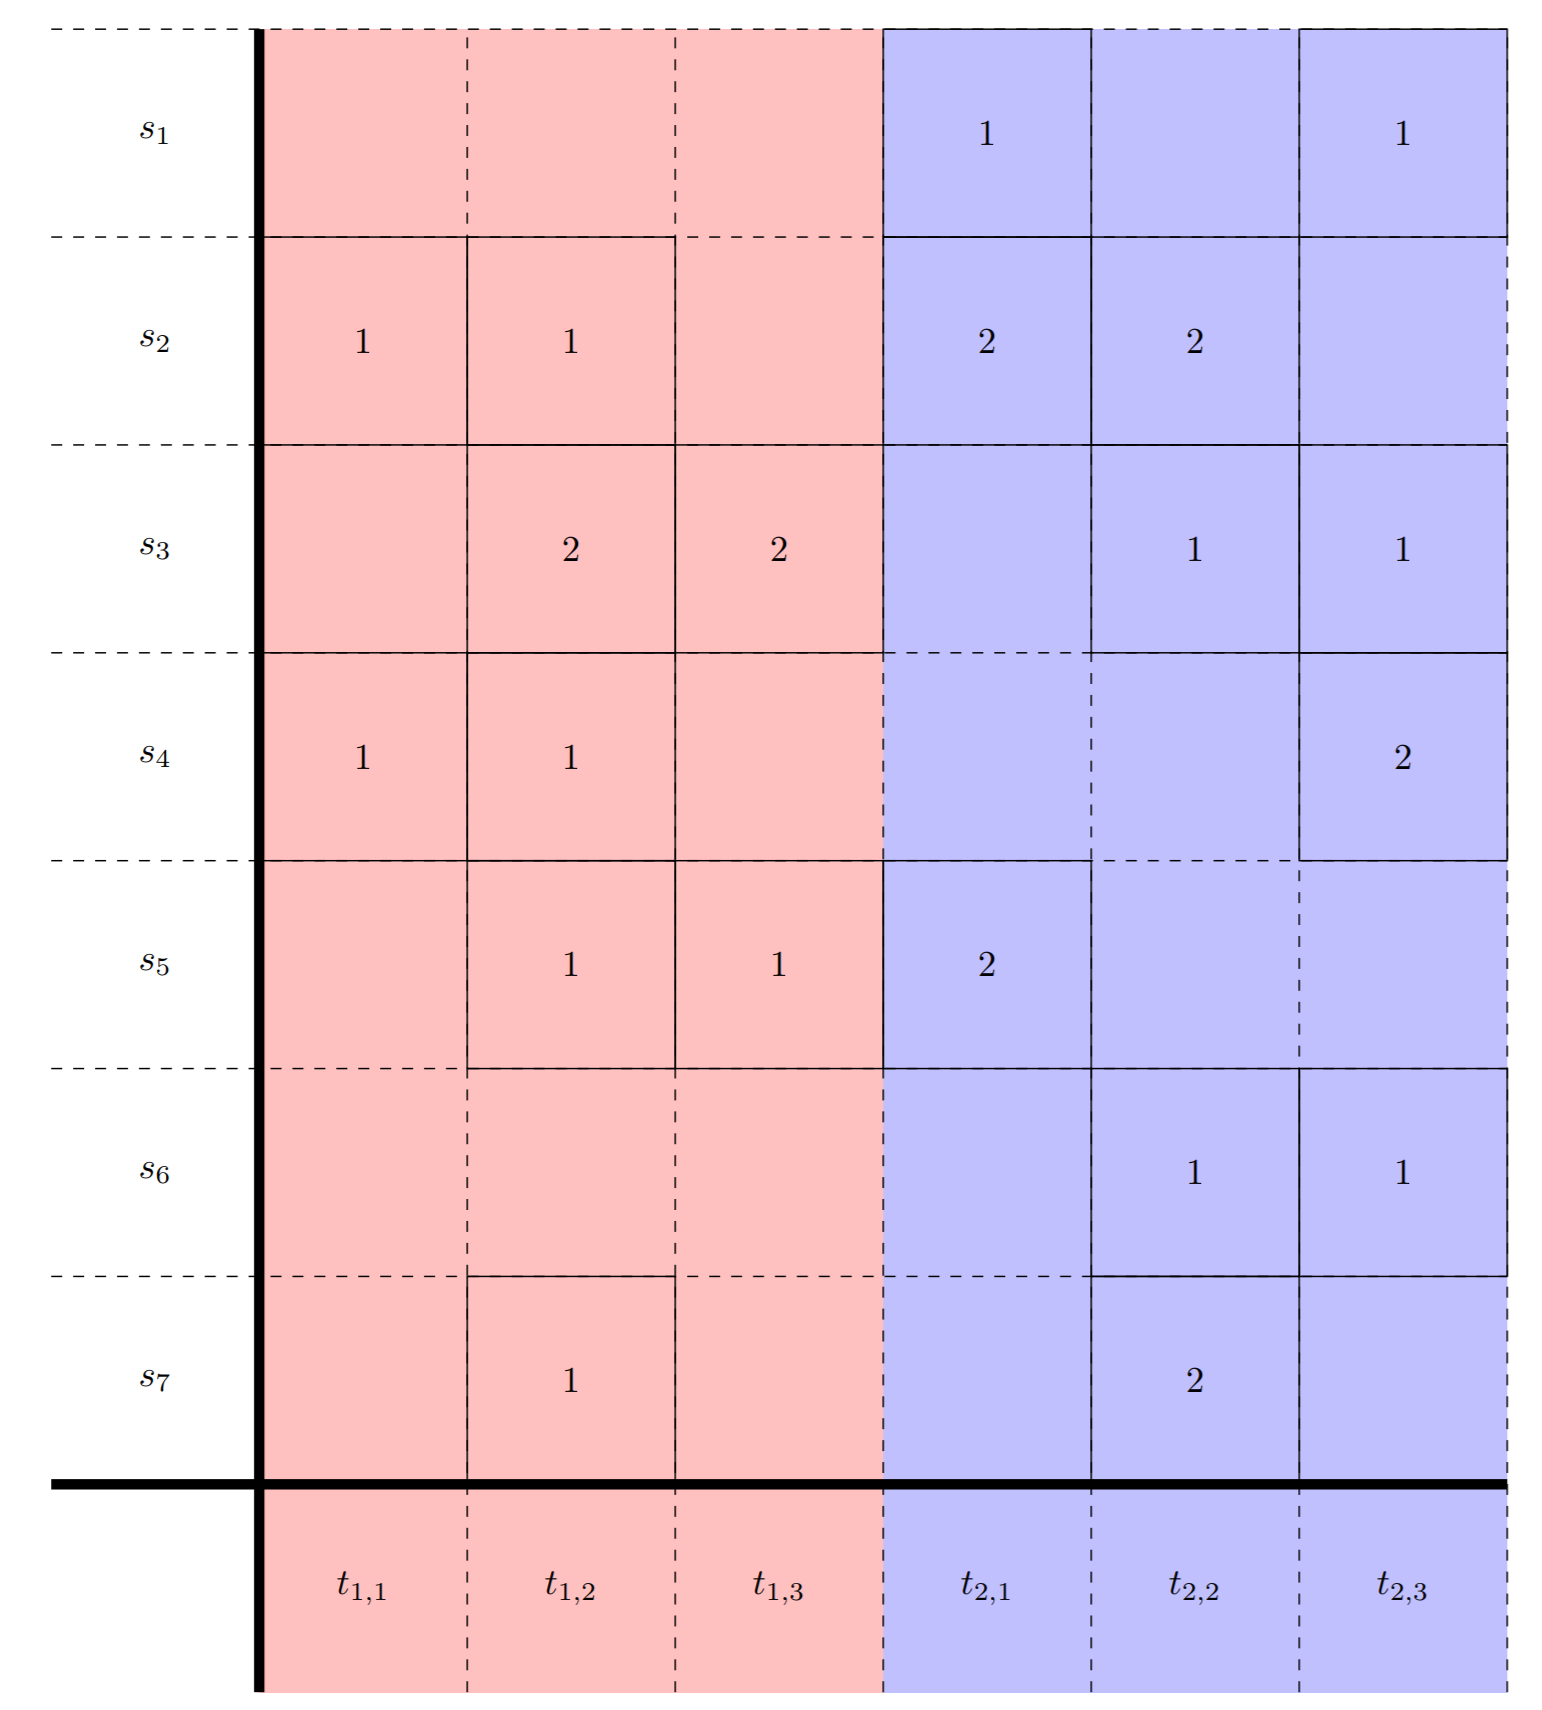
To search for this subgraph, we should also use some sort of cost function on the subgraphs found. One of the simplest ones would be a sum over all students of the index into their preference list of their assigned lab group: \[ \sum_{i=1}^n index(pref_i(group\_assigned_i)). \] As an example, if the preference list of a student was (Group 2, Group 1, Group 2) and the student was assigned to Group 2, then the cost associated would be \( 2 \). Using this as a cost function, our goal is to minimize this sum since this would correspond to students being assigned to groups which they preferred least. We can now implement an algorithm for finding this subgraph.
GIVEN
- Set of students with their time availabilities and their list of preferences.
- Set of lab groups with their time availabilities.
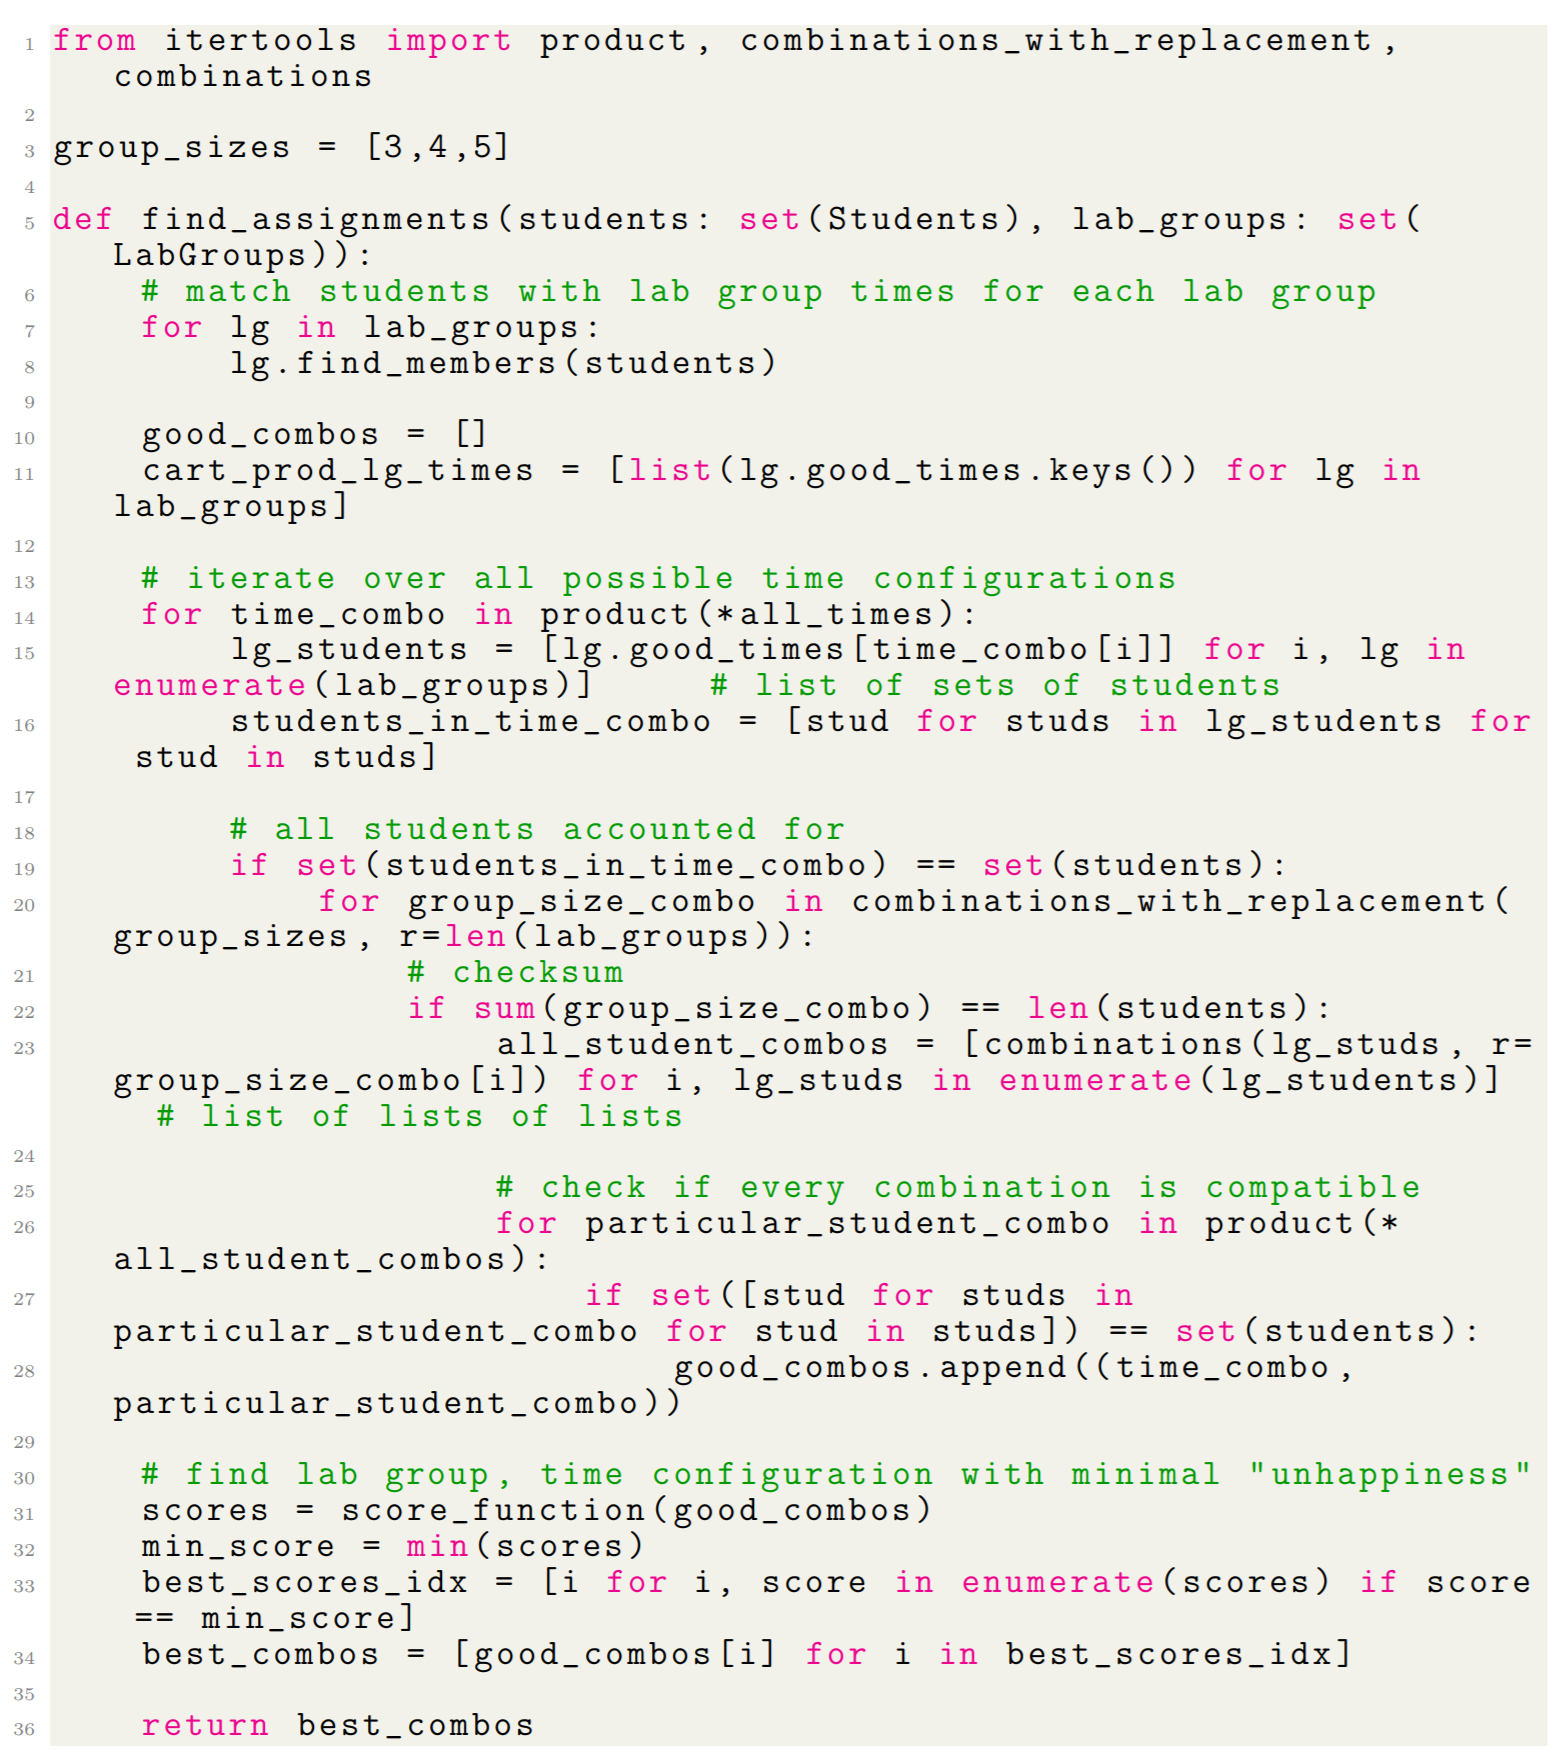
PROCEDURE
- Find matching student times and lab group times.
- Select subset of columns (one from each lab group). Make sure union of columns contains all students.
- Select subsets of students from each column. Make sure union contains all students and has size between \( a \) and \( b \).
- Repeat (2) and (3) until all possible lab group configurations have been exhausted.
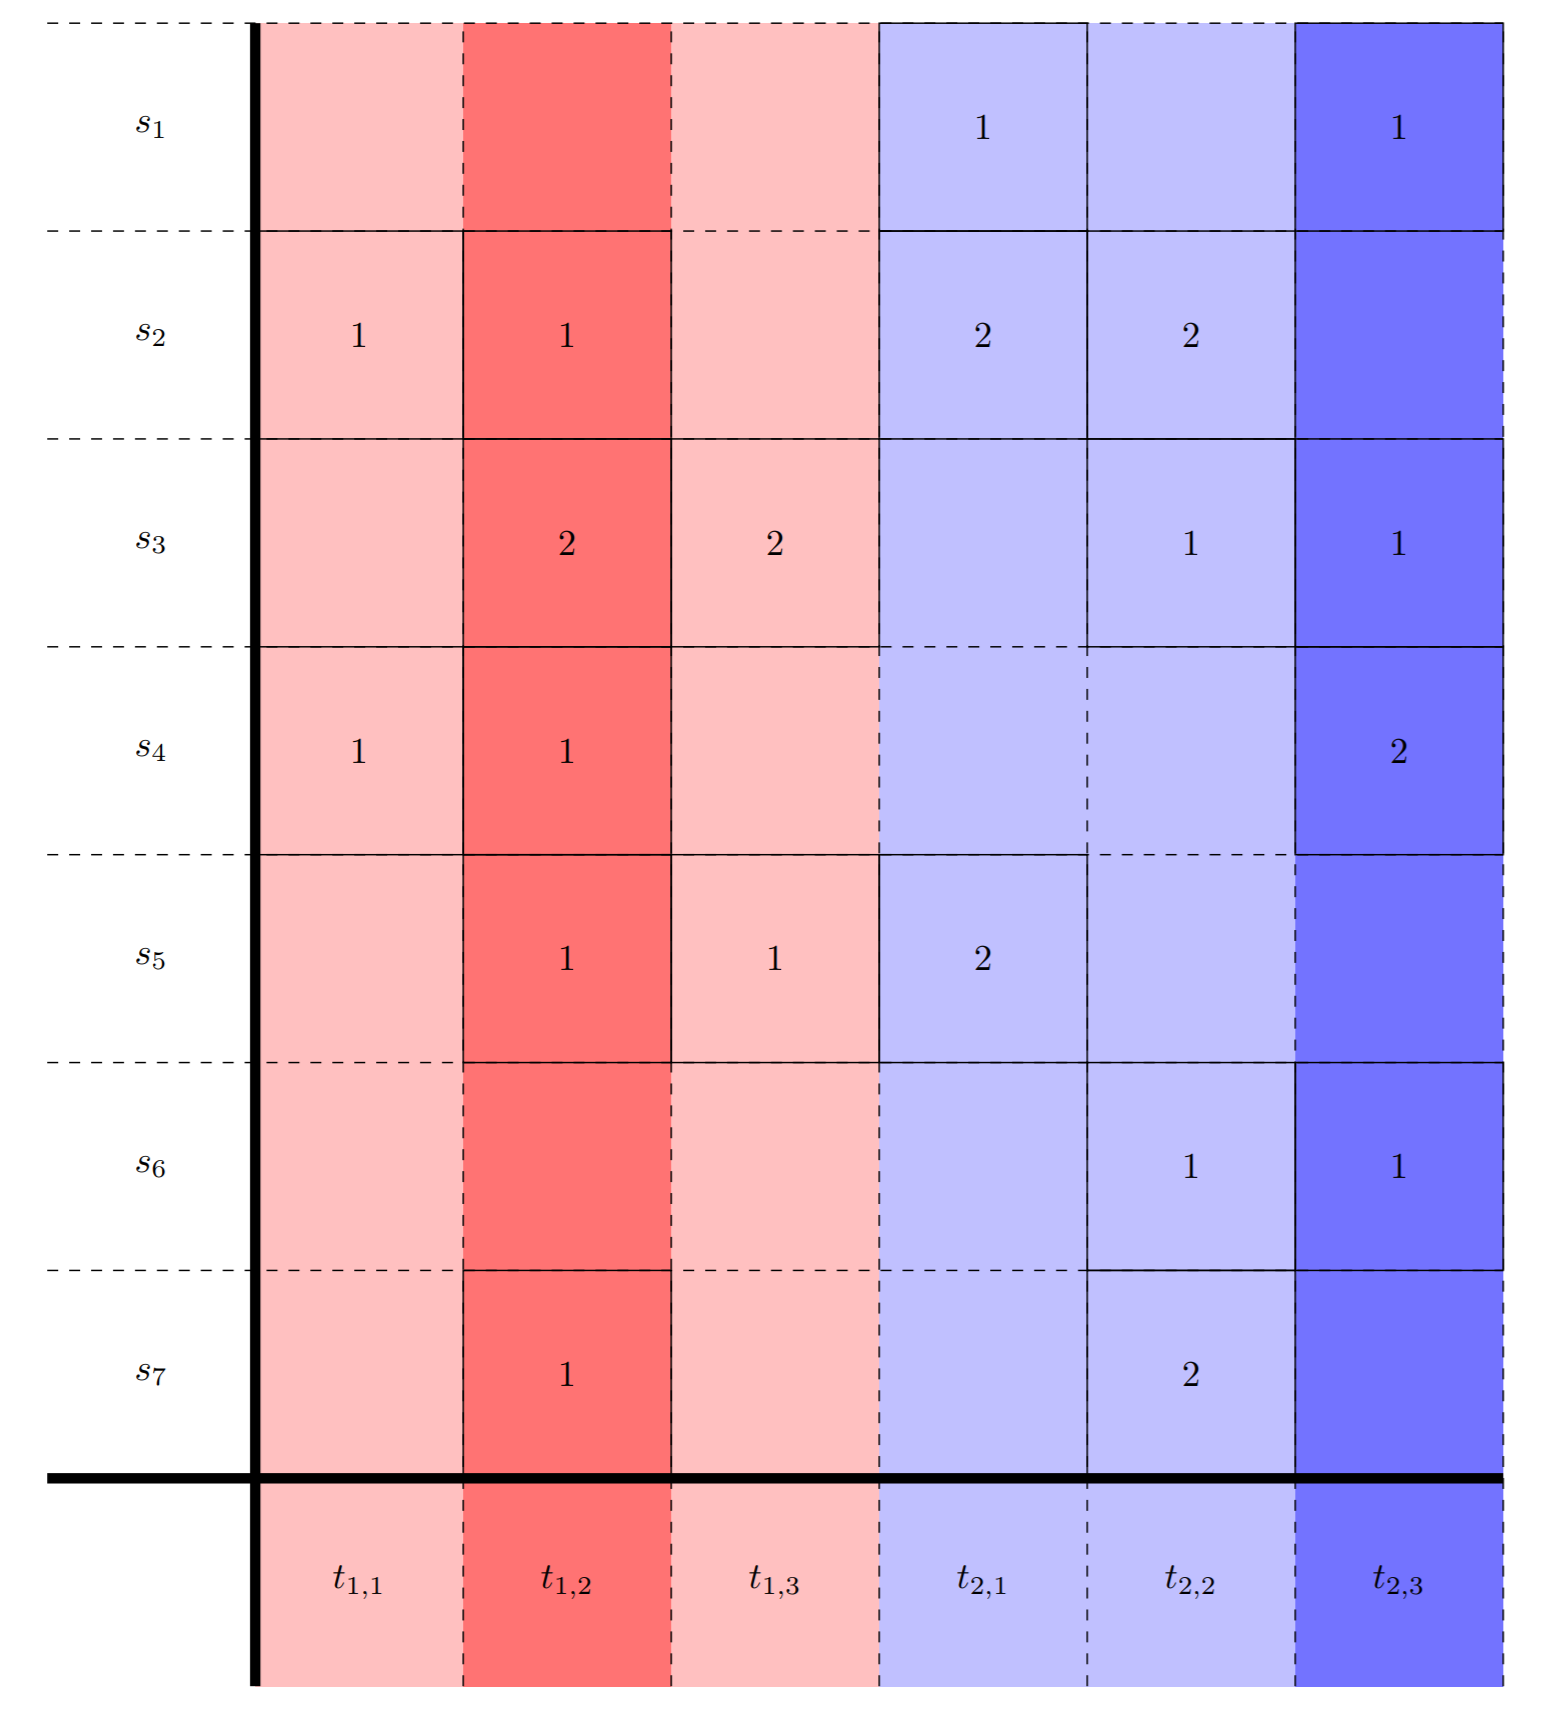
- Compute the happiness score for each group, e.g. sum the preference ranking of the assigned group for each student. In the example shown, the group configuration has a happiness score of \( 1+1+1+1+1+1+1 = 7 \). This is actually the best result for these students and lab groups.
- Return the group configurations with the minimum happiness score.
Investigated with Jessica Appel, Michael Boyd, and Kathryn Schantz under the mentorship of Kate Ponto. Code can be found here.